10 Jun 2015 Prometheus Monitoring System
Ever since Opsview officially announced the deprecation of Opsview Core, the Nagios based monitoring and alerting system we use for monitoring applications and services on all servers that we manage, we have been looking for alternative monitoring solutions.
Last week, we started exploring Prometheus, a newly released open source monitoring and alerting system mainly written in Go and developed by SoundCloud and other contributors. Starting as a pet project in 2012, it was then adopted by SoundCloud to address the limitations of its then-existing monitoring setup that was built upon StatsD and Graphite.
Prometheus features a multi-dimensional data model where data is stored as time series uniquely identified by a metric name and key/value pairs known as labels. Using Prometheus’s powerful query language, this time series can be sliced and diced along the dimensions identified by labels and can be graphed as well.
Prometheus architecture is fairly simple. Prometheus server scraps metrics/time series from long-lived jobs through HTTP pull requests. For short-lived batch jobs which can not wait for Prometheus server to scrap their completion metrics, It also offers a Pushgateway to which they can push such metrics. Prometheus server can in turn scrap these metrics from the Pushgateway. For alerting, it offers the Alertmanager but it’s still experimental. An alternative would be to use the Nagios plugin it offers for alerting on Prometheus query results on any Nagios setup. For visualization, it offers a GUI-based dashboard builder, PromDash, which is a rails application with a SQL backend. High availability can be achieved by running identical Prometheus servers on two or more separate machines. Identical alerts will be deduplicated by the Alertmanager.
Unlike traditional monitoring solutions that use out-of-the-box plugins to check services and applications (Ex. Nagios), Prometheus requires instrumenting the application code via one of the Prometheus client libraries. These libraries implement the Prometheus metric types and expose metrics for Prometheus server to scrap.
Prometheus offers a number of exporters for out-of-the-box metric exposition. These are useful for exporting metrics when code instrumentation is not feasible. Among the exporters it offers is the Node Exporter for exporting machine metrics such as disk, memory and network statistics.
To get better idea of its multi-dimensional model using the labeled time series and its powerful query language, we decided to try out Prometheus to monitor itself and three different LXC containers.
First, we installed Prometheus on an Ubuntu 12.04 LXC container 192.168.2.14 ( Prometheus build has a memory requirement of 2GB ).
[code]git clone https://github.com/prometheus/prometheus.git
cd prometheus
make build [/code]
and installed Node Exporter on the Prometheus container and 3 other Ubuntu 12.04 LXC containers (192.168.2.15,192.168.2.16,192.168.2.17),
[code]git clone https://github.com/prometheus/node_exporter.git
cd node_exporter/
make
./node_exporter[/code]
Node Exporter listens at port 9100 (netstat -tanp|grep -i node_exporter) and container metrics are available at http://192.168.2.15:9100/metrics, http://192.168.2.16:9100/metrics, http://192.168.2.17:9100/metrics
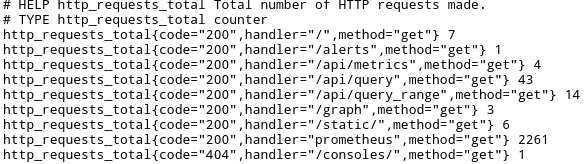
Sample metrics collected at http://localhost:9090/metrics
As shown above, among the time series Prometheus collects about itself is the total number of incoming HTTP requests http_requests_total. It attaches the labels/dimensions code, handler and method to this time series which in turn can be queried, graphed, and filtered by these labels.
Next, we add the following configuration in prometheus.conf.
[code]# Global default settings.
global: {
scrape_interval: "15s" # By default, scrape targets every 15 seconds.
evaluation_interval: "15s" # By default, evaluate rules every 15 seconds.
}
job: {
name: "prometheus"
scrape_interval: "5s"
target_group: {
target: "http://localhost:9090/metrics"
target: "http://localhost:9100/metrics"
labels: {
label: {
name: "group"
value: "prometheus"
}
}
}
}
job: {
name: "nodes"
scrape_interval: "5s"
target_group: {
target: "http://192.168.2.15:9100/metrics"
target: "http://192.168.2.16:9100/metrics"
labels: {
label: {
name: "group"
value: "production"
}
}
}
target_group: {
target: "http://192.168.2.17:9100/metrics"
labels: {
label: {
name: "group"
value: "staging"
}
}
}
}
[/code]
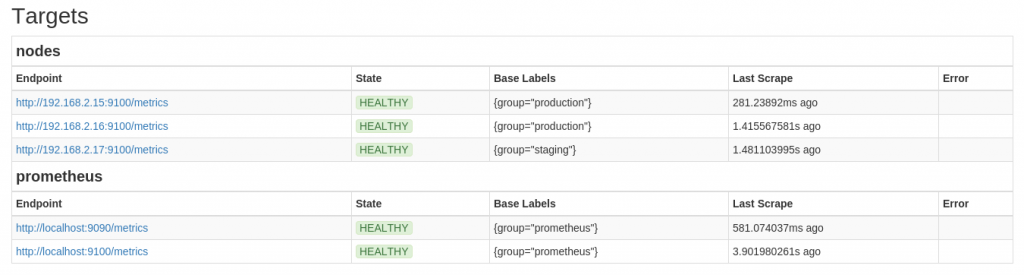
This basically configures two jobs. The first one - with the name prometheus - scraps the target group that includes the two endpoints http://localhost:9090/metrics and http://localhost:9100/metrics for Prometheus own health metrics and its container metrics, respectively. We define a new label group with the value prometheus for this target group.
The second job - with the name nodes - scraps two target groups, the first one has the two endpoints http://192.168.2.15:9100/metrics and http://192.168.2.16:9100/metrics and belongs to group production, while the other has the endpoint http://192.168.2.17:9100/metrics that belongs to group staging.
Next, we start Prometheus:
[code]./prometheus -config.file=prometheus.conf[/code]
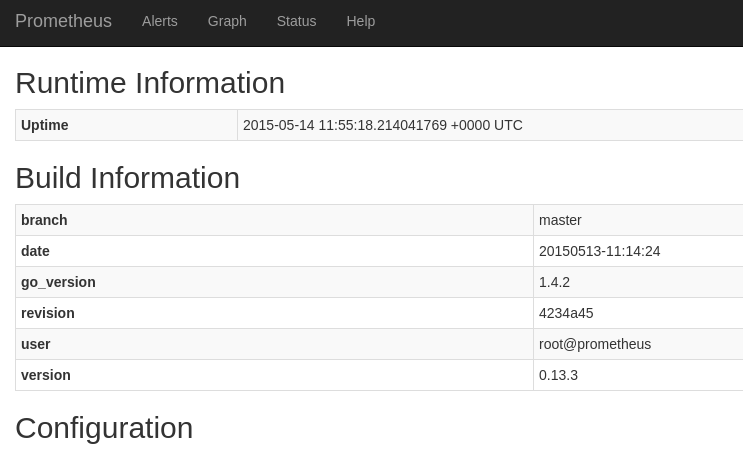
Prometheus status page starts at http://localhost:9090/. It shows build information, configuration, rules, and target groups.
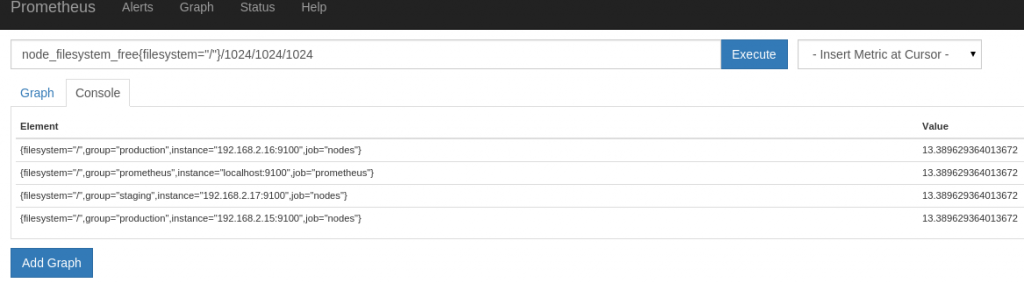
We next use the expression browser under the Graph tab to perform some queries for disk space , memory, HTTP requests.
to get the free space in the root filesystem in GB for each of the 4 nodes, we use the following query,
[code] node_filesystem_free{filesystem="/"}/1024/1024/1024[/code]
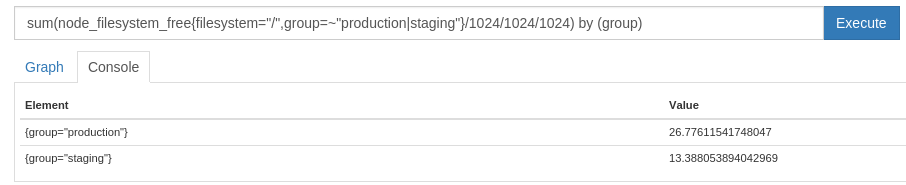
The sum of the free space in the root filesystems for nodes in the production or staging group aggregated by the group label
[code] sum(node_filesystem_free{filesystem="/",group=~"production|staging"}/1024/1024/1024) by (group)[/code]
The amount of free memory in GB for Prometheus server
[code](node_memory_MemFree+node_memory_Buffers+node_memory_Cached{instance="localhost:9100"})/1024/1024/1024[/code]
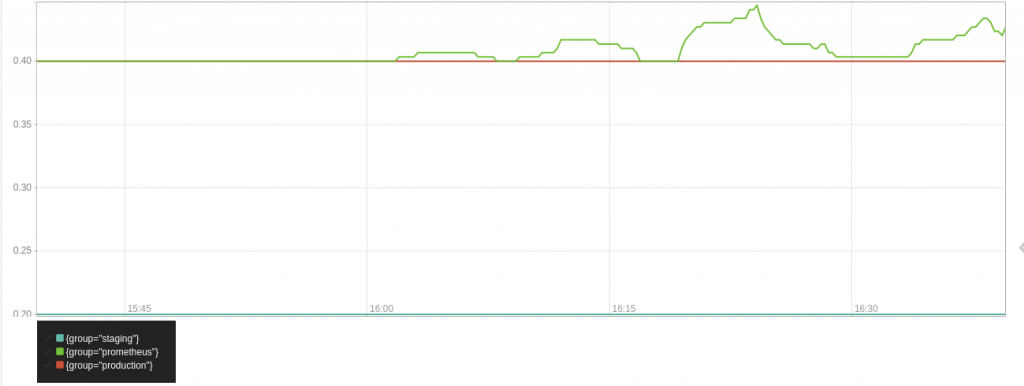
The rate of incoming HTTP requests with response 200 over the last 5 minutes aggregated by the group label and graphed
[code] sum(rate(http_requests_total{code="200"}[5m])) by (group) [/code]
Additionally, Prometheus allows adding recording rules to precompute a frequently used metric expressions.
Conclusion
With its multidimensional model, flexible query language, high availability, autonomous server nodes, and multiple visualization and alerting capabilities, Prometheus proves to be a powerful monitoring system. The only downside would be the limited number of exporters out there and the need for code instrumentation, though, one can argue that such a reliable service monitoring always comes at a price.