
31 Aug 2015 First Look at The ELK stack
We are still going through monitoring tools to find a replacement for Opsview. This time we are going to discover some features with the ELK stack (elasticsearch - Logstash - Kibana).
ELK stack is considered one of the important logging solutions, that can store and analyze various logs from different services in your environment, also using Logstash plugins can provide great enhancements, as an example for this, in this post we are going to discover using the ELK stack with a ruby application.
Since there is no official docs for installing the stack, I followed the steps from Devops Library and installed the stack which was easy with the .deb packages, tested with simple syslog input for logstash and played with the Kibana search, then I thought of getting the ELK stack to graph the different duration stats logged in Rails’ <environment>.log:
[code light=”true”]Completed 200 OK in 19ms (Views: 10.2ms | ActiveRecord: 1.7ms)[/code]
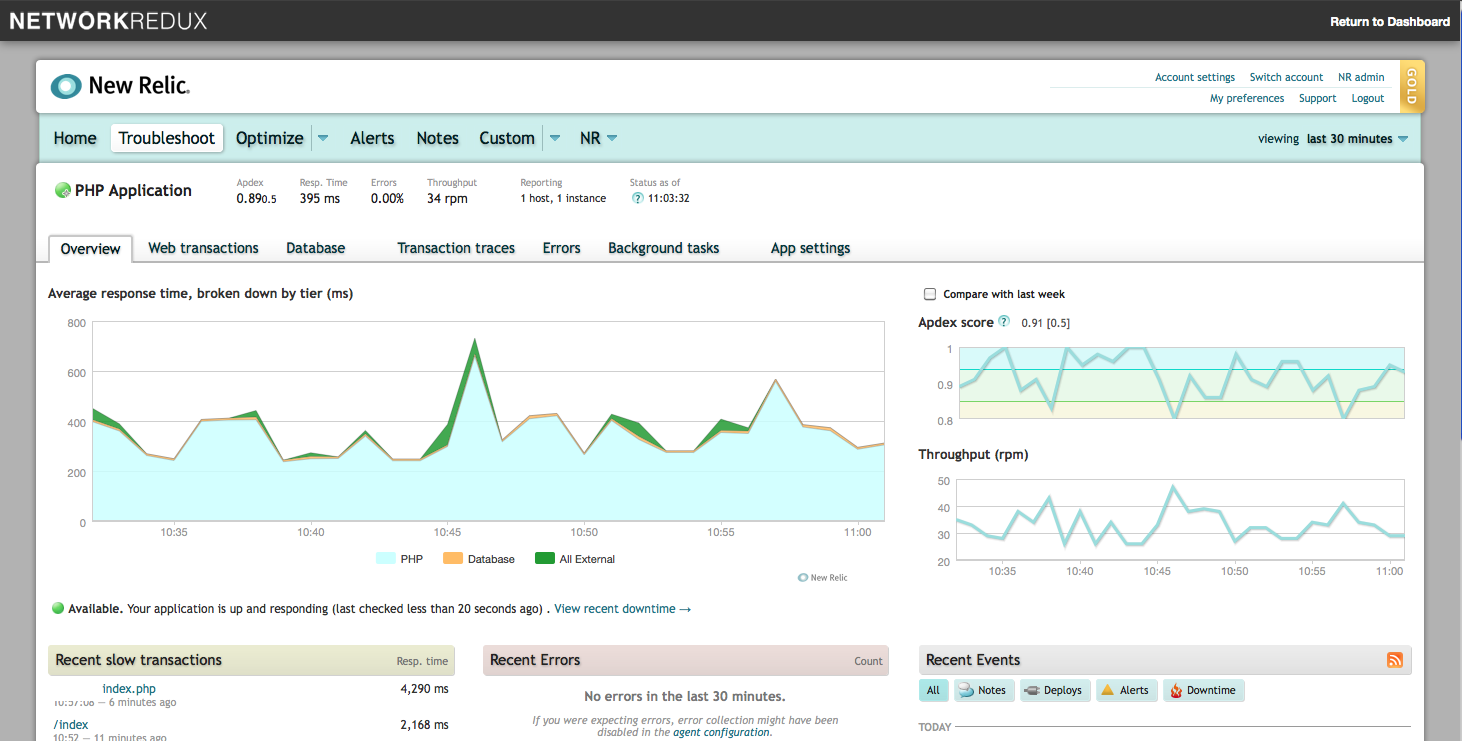
This would create a graph similar to the ones NewRelic creates for your web app.
To do so I made a deployment of a Rails application “Teambox” which requires Ruby1.8 and then installed the Logstasher gem. It turned out that Logstasher requires a Ruby version of 1.9.2 or higher and not just any version of Ruby as the RubyGems pages states.
I went ahead and installed Ruby 1.9.3 and deployed Redmine, installed Logstasher and the application was ready for testing. I used the following configuration for Logstash:
[code light=”true”]
input {
file {
path => “/var/www/redmine/log/logstash_production.log”
type => “rails”
codec => “json”
}
}
output {
elasticsearch {
host => localhost
}
}[/code]
Now we can retrieve the log data from Kibana’s Discover tab, use filters and customize the displayed columns. This is what a document looks like after using the Logstasher gem:

Next step, Visualize.
I chose “Area chart”, filtered based on @type and chose “rails” documents. Configured buckets (X-Axis) and metrics (Y-Axis) as follows:
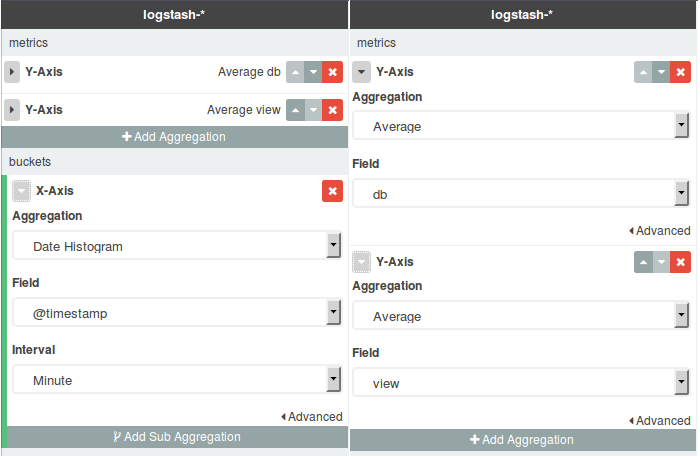
Note the fields I selected to be aggregated on th Y-Axis view and db; these are the fields holding the duration time for Rails and Mysql.
I tried to create as much data as possible by randomly exploring and executing actions on Redmine, but then I used siege on a list of URLs to create a bigger data set:

You can see the spikes caused by my requests and the continuous step that was caused by siege.
I got the results I was aiming for, but the graphs are not that pretty (it is steady because all the pages I was hitting had minimal database queries, and the other heavier pages required authentication).
We need to go further and try out different scenarios with different types of metrics and different types of logs on this stack. Maybe our next step would be configuring this stack to display and create graphs for webserver access and error logs.